Blog
Interactive Data Visualisation
Using {htmlwidgets} with/without {shiny} in reproducible Open Data workflows.

Using Predictive Modelling to Study the Impact of COVID-19 on Energy Consumption
Using elastic net regression and neural network models to predict what would have happened in the absence of the pandemic, and comparing these ‘counterfactuals’ with observed electricity and gas consumption in several hundred households.

Let R browse the web for you: An introduction to web-scraping with RSelenium
Nicole Schwitter introduces how R can be used to collect data from web pages.

R and Docker
In this online event, we continue the reproducibility theme from our last meetup, with James Tripp introducing Docker containers and how they can be used with R. See full details below.
Managing R script dependencies: automagic and renv
In this first session of the reproducibility series, we introduce two methods to deal with library dependencies: {automagic} and {renv}
Code Review
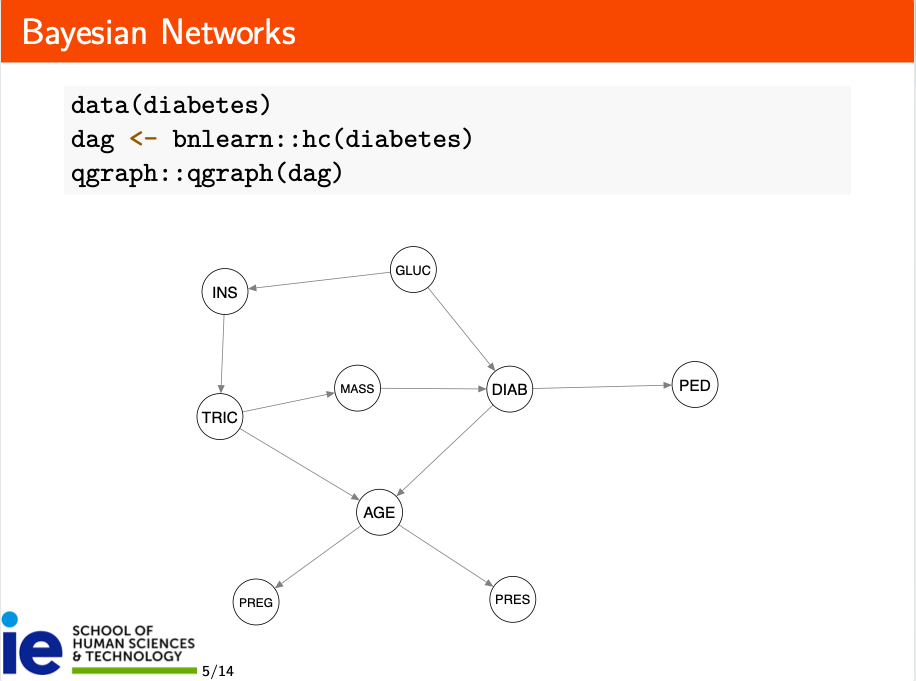
Sensitivity and Robustness Analysis in Bayesian Networks with the 'bnmonitor' R package
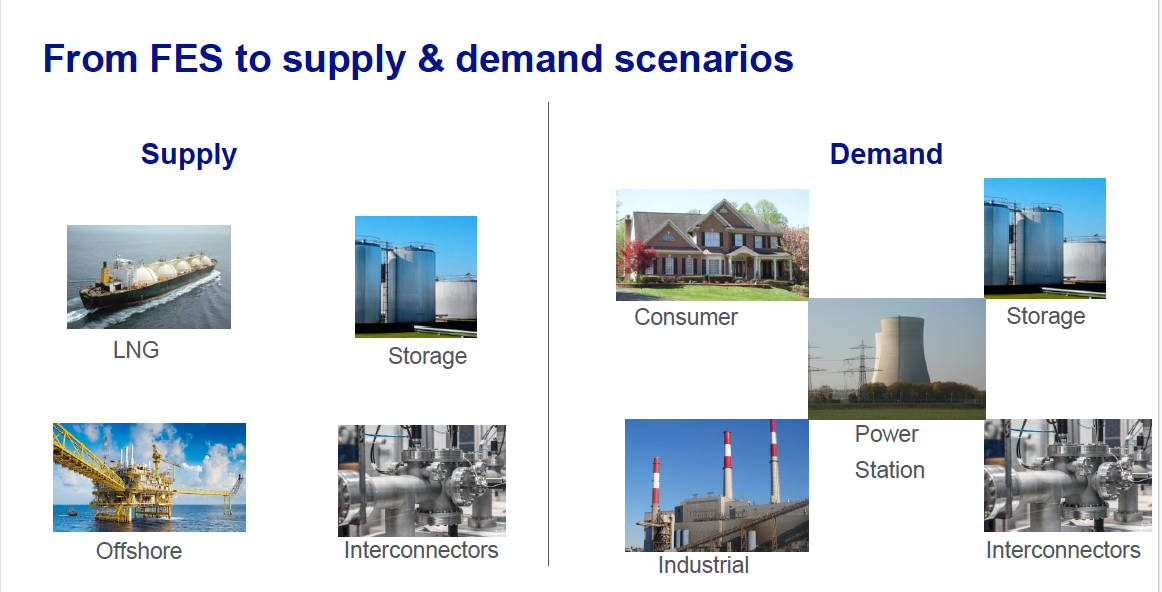
Long Term Gas Supply & Demand Scenarios
Welcome to Warwick R User Group
Welcome to our new blog, Warwick R User Group. We hope you enjoy reading what we have to say!
The Grammar of Graphics: an introduction to ggplot2
Animated plots
`Animation` is an R package to create and export animations to a variety of formats (HTML/JS, GIF, Video, PDF), and it also serves as a gallery of statistical animations.

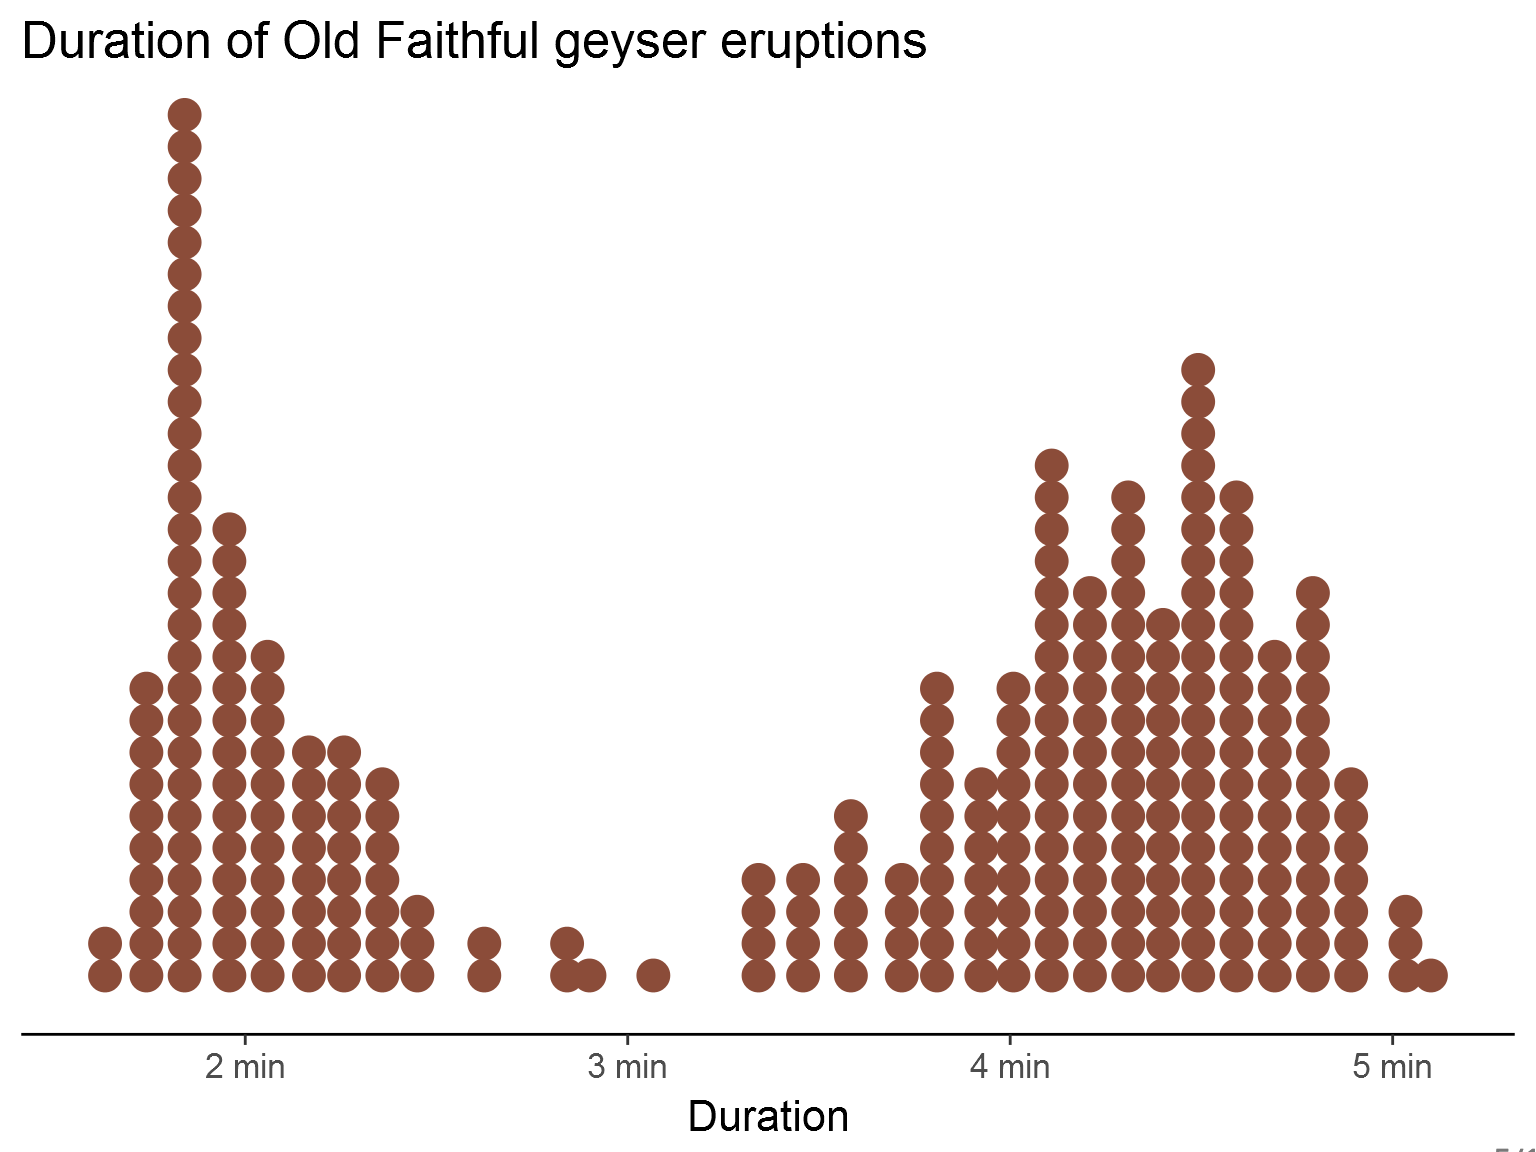
Pitfalls of 'dynamite' plunger plots

Procrastinating in R: emoji plots
Use `emojifont` and `emoGG` in your plots.

An introduction to Shiny
A beginner's guide to Shiny